All Posts
Projecting Forward values of Fannie Mae Home price index for Pulsenomics survey
I reiterate and expand on my blog from May 2025, arguing that Pulsenomics survey contributors can use the CME Case Shiller 10-city index futures as a tool in forecasting Fannie Mae indices.
Using a combination of HPHF Ratios and CME Case Shiller futures to infer forward values on Fannie Mae home price index
Using a combination of CME Case Shiller 10-city index futures, and an HPHF Ratio Agreement on the Fannie Mae/Case Shiller 10-city index, one can create forward values for the Fannie Mae index and therefore implied forward HPAs.

An opportunity for followers of the quarterly Pulsenomics survey to express views on Fannie Mae home price indices for year-end 2025-2026
With the release of the quarterly Pulsenomics survey of 100+ home price forecasts, I raise this issue of how these forecasts look vs CME Case Shiller futures. I also offer a protocol where those interested can stake a view on forward Fannie Mae home prices.

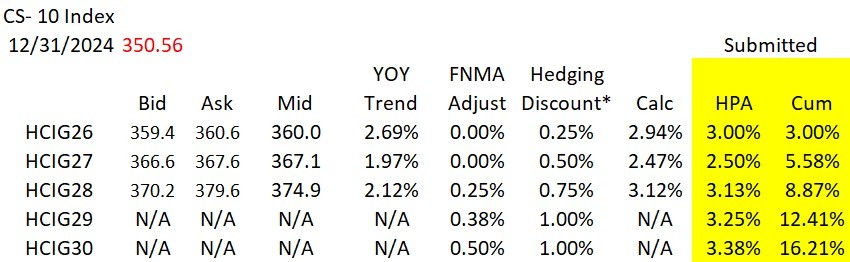
CME Case Shiller Scorecard March 31 (v Dec 2024)
I've posted a summary of quotes for the CME Case Shiller home price index futures as of March 31. The table includes prices changes since Dec 13, 2024, bid/ask spreads, and implied gains.


Intercity Spreads Explained
Intercity Spreads are a potentially useful tool that allows users to express a view on forward HPA between either two metros, or a metro and the 10-city index.

Expressing views on Atlanta home prices for 2025-206
Want to buy/sell Atlanta home price indices for Feb '26, '27? Consider a combination of CME 10-city index futures and an HPHF Ratio Agreement. The combination is consistent with prices 2-3%> spot (for Feb '26).

Using Calendar Spreads to Infer HPA for 2025 across various metros
CME Calendar Spreads on the Case Shiller home price index futures may be useful in inferring implied HPA across various metros. In addition, users can take positions in the "market for HPA".

City v Metro Ratio Agreements
Here's a way to dig into differences between City and Metro home prices. While sometimes they are very similar there are areas (e.g. DC) where City prices diverge from Metro prices. I suggest a way to express views.

Logistics for OTC Parcl Index Agreements
Here's a short piece on the logistics of HPHF Agreements referencing home price indices from ParclLabs.

Adding more information to/ Reformatting/ HPHF Ratio Agreement Template
I've updated the template for Ratio Agreements to highlight the implied forward values for Feb '25-'27. There is also a section with housing economic news. Please review, critique and guide me to other metros that you'd like to see referenced.

Risk of change in home prices can be hedged
Potential home buyers could've used CME Case Shiller home price index futures to hedge against the risk that the income needed to afford a home might rise between Jan 2020 and Jan 2024.

Challenges in using averages of averages: Average Home price/Median Income
Presentations of average (or median) home price to median income can be misleading as it involves averages of averages. Income inequality may explain part of the rise in home price/income ratios.

Four year performance of CME Case Shiller regional contracts_ long hedging
A review of the last four years of closes on the CME Case Shiller regional home price index contracts shows the benefit of "long hedging" to those worried about upside price moves.

A review of Feb 2024 contract to revisit convergence and cash settlements (with third party forecasts)
Another expiration of quarterly contracts prompts me to review the concepts of cash-settlement and convergence, this time with some third-party forecasts.

If five analysts say home price will rise 4%, who's the most bullish? Examining performance of home price indices
While all home price index methodologies are unique, the results of these differences may range from small to large. I conducted a review of seven indices to see the correlation across all.

Why use a Ratio Agreement/basis, correlation risk
Trying to assess the basis risk between a national index and those of 100 metros led me to three simple observations.

Options Illustration/Update
I had an inquiry on options, updated my options template, and decided is was time (given new viewers) to update my philosophy/ share some of the moving parts.

Expanded Single Contract Template
I've revised my single-contract template to include more information. Implied HPA gains, calendar spread quotes, a measure of index gains, and the change in the value of the contract since year-end 2022 have all been added.

How to express a view on 2024 home prices
Users can play the "Home Prices in 2024" debate in a variety of fashions. The benchmark CME Feb '24/'25 calendar spread has moved from +10 (Feb '24 higher than Feb '25) to near flat.

Recap for 2023
I've posted a recap of activity in the CME Case Shiller home price index contracts for 2023.

Don't let the search for perfect be the enemy of "good enough"
Investors with longer term bullish expectations on home prices (e.g. Pulsenomics survey) might rethink how much index precision they need.

Long hedging in a flat HPA curve
People looking to eventually buy a home can lock in some 3-year forward index levels at less than today's spot indices.

Extending Ratio Agreements to other cities by referencing Freddie Mac home price indices
This blog builds on the work of the last few blogs to demonstrate the process by which HPHF Ratio Agreements can be used with Freddie Mac home price indices, to infer forward clearing levels (not expectations) for the many cities not referenced by CME Case Shiller home price index futures. These Ratio Agreements can be used to hedge either relative risk, or if used in combination with CME futures on the Case Shiller 10-city index, some component of outright regional home price risk.

Where might a forward market clear for the Freddie Mac National home price index?
Key to an upcoming blog on Freddie Regional /Freddie National Ratio Agreements, is an understanding of how one might create a forward market-clearing level for the Freddie National index, or how the Freddie National index might relate to the Case Shiller 10-city index (which is referenced in CME futures contracts).

Case Shiller forecast for August 29th
Here's my forecast for the Case Shiller indices for Aug 29th release, as well as markets (from Aug 15th) for the ten metros that are referenced by CME contracts. Note that I've also listed a set of quotes for the second ten metros (e.g. Phoenix, Dallas) not referenced by CME contracts.

Illustrating the Difference Between Expectations and Clearing Levels for Forward HPA
Zillow's most recent update to their 12-month HPA forecasts provides an opportunity to revisit my thesis that longer-dated CME futures tend to clear at a discount to expectations.

Case Shiller 10-city Ratio Agreement Graphs
Here's an updated version (through Aug 8th) of both historical ratios (of regional index divided by 10-city index) as well as implied forward Ratio Agreement levels based on quotes in the ten regional contracts for Feb 2024 and 2025 expirations.

Revisiting HPHF Ratio Agreement Template
Here's a review of how to use HPHF Ratio Agreements, and an introduction to a new graph that illustrates implied regional prices.

Month-end status
Prices were higher in May on lite volume. Bid/ask spreads contracted, and curves inverted slightly more from Feb 2024 to Feb 2025

Trading turns in cycles
April saw massive price gains in the CME Case Shiller futures, demand move from 2024 to 2023, and flipped the contracts with most negative sentiment into the biggest winners.

Updates to Resources Page
I've updated the Resources page to bring historical volume and OI current, as well as to post graphs on a range of underlying contracts and HPHF Ratio Agreements.

Expressing a view on whether home prices will be higher at year-end 2024 v year-end 2025
A review of calendar spreads and how users might use them to express a view on whether home prices will be higher/lower in Dec 2024 vs Dec 2023.

Price updates on all contracts Feb 2023-2027
A rate instance where every region and expiration has a two-sided quote (from Feb 2023-Feb 2027).

Scorecard for CME Case Shiller home price index futures
I've posted two templates to allow users to see stale prices on the CME Case Shiller home price index futures, and to see how such prices can be converted into useful information (e.g. implied YOY % differences).

Update: Odds and Ends
This blog has a summary of some of the things that I've been working on (e.g. filling out quotes in longer-dated expirations, InterCity spreads) as well as the introduction of an "Axe" page, where users can share areas that they'd like to add/reduce exposure.

Performance of regional contracts during 2022
Trading activity in the CME Case Shiller home price futures regional contracts during 2022 showed how expectations changed dramatically, not only at a absolute level, but between regions. Whether or not current underlying home price fundamentals are captured in current quotes is an open question.

CME Case Shiller Futures- Key Lessons from 2022
A graph of CME Case Shiller futures on the HCI/CUS(10-city index) contracts during 2022 can be useful in illustrating several lessons on how users might interpret what the prices suggest.

CME Futures higher post Tuesday Case Shiller updates
Tuesday's update of Case Shiller indices were higher (in some cases much higher) than the quotes on the expiring Nov 2022 (X22) contract. In response, longer-dated contract prices rose. The Case Shiller numbers (both prices and pair counts) are consistent with a less severe sell-off in home prices.

Nov expiration/Settlement/ How to read same numbers differently
The Nov '22 CME Case Shiller futures contract should frame two sets of headlines for Tuesday morning when the indices are updated. One view is that there have been backward looking year-on-year price gains. The other, will show that index values have already fallen from the numbers released in August. Keep an eye on CME futures, as prices are consistent with further large price declines.

Post Oct Case Shiller #'s/ Impact of Declining Pair-Counts
CME home price index futures rose after numbers were released on Tuesday. I suggest that two factors are at play: 1) role of convergence dwarfing discount to expectations, and 2) reduction in pair count kept spot from falling as much as it might have with "normal" volume.

Expressing a view on 2023 HPA -Calendar Spreads
The CME Case Shiller home price index calendar spreads allow users to express views on the magnitude and timing of the current sell-off in home prices. For now, the contracts are priced for a decline in prices for 2023 but a (smaller) gain in 2024. You're welcome to join the debate!

Buying when prices drop 20%?!?
Many claim that home prices will fall, and that they are waiting to buy where prices are 20-25% off their peaks. Why wait, as you can access that exposure today (in a more liquid, granular format) using the CME Case Shiller home price index futures?

CME Case Shiller Futures lower after Sept 27th numbers
Quotes on CME Case Shiller futures were much lower following today's update of the index values.

I'm back, with a new way to review forward prices
I'm back from vacation, am plowing through past emails and third-party research, but wanted to share a new way of looking at forward clearing levels on regional contracts.

What's being traded
Trading for the last year has been concentrated in the 10-city index contracts, and in the February expirations -which is exactly where it should be given the volume traded here.

On Vacation Aug 26-Sept 11
On vacation, and taking a break from market making, Aug 26-Sept 11.
The 10% drop in home prices call/ Shiller was correct....however
Shiller was correct! Longer-dated futures clear at a 10% discount to spot. However......

Two ways to read/express views on regional home prices
There are two ways that a reader can see the clearing level for the basis risk between one city and the Case Shiller 10-city index (InterCity Spreads on the CME, and OTC HPHF Ratio Agreements).

Reformatting HPHF Ratio Agreements for Feb 2024
I've updated my template for HPHF Ratio Agreements to include extending expirations out to Feb 2024.

When forward home prices fall below spot
What should happen when sellers take clearing prices to discounts to spot? What opportunities does this present to natural longs? What happens to home equity monetization programs?

CME Case Shiller futures trending lower- are the stars aligned for market growth?
A combination with hedgers looking to sell, while natural longs (i.e. Millennials and institutions looking for home price exposure) means that the market for home price hedging instruments (to include CME Case Shiller futures) could grow this cycle.

May 31 Case Shiller index updates v CME prices
May was a busy month, with high volatility in prices, but the CME contract quotes eventually bracketed most of the updated CS indices.

I'll miss Tuesday May 31 index update
I will miss the Tuesday May 31 index update, as I'm traveling. I'll be back at my desk on Wednesday.
The evolution of Ratio Agreement template- How to read quotes for Raleigh (e.g.)
I've updated my template for how I show the components of HPHF Ratio Agreements (based on feedback from readers, that they wanted more information on what the numbers mean).

What's the benefit of futures if home price gains are already "factored in"
Today, users can't buy the spot Case Shiller index and deliver it (at +10%) versus futures, but a wave of new products to tap the $23Trillion in home equity may change that.


Using Ratios to Better Understand InterCity Spread Quotes
I've borrowed the concept of HPHF Ratio Agreements to better illustrate how IC spreads can be converted into more transparent forward views on relative performance of home price indices to some futures points in time.

Adding Ratios to view trends for single city graphs
I've added ratios to show trends in relative performance of one region vs the ten-city index contracts. In this post I've highlighted SFR v HCI


SFR Rents, Correlation to home prices, and ratio analysis
Despite low rent growth, the ability for the tech community to work remotely, and headline homeless issues, San Francisco home prices (SFR index) have matched those of the rest of the Case Shiiler 10-city index, and are priced to do so again in 2022.

Illustrating Ratio Agreements/ Outright Hedging combinations, with Nashville
I've used Nashville to illustrate how one can express views on the relative performance of a region vs. a more national index, as well as (when combined with futures) to express an outright view.

Case Shiller index results v CME Futures Prices from T minus 1
The Feb 2022 contracts settled on today's Case Shiller #'s. Many fewer outliers that in previous quarterly expirations. More work to do before I can comment on the impact of updated indices on longer-dated CME contracts.

The danger of citing correlations with (the recent) outlier moves in home prices. Using both absolute and relative performance tools to hedge regional risk.
A comparison of moves between regional and national home price indices reminds me to be cautious when relying on correlations over a sample with outlier moves, and consider all of the tools at your disposal, when looking to hedge a regional exposure to home prices.

Why a regional overlay might be important in hedging home prices post-Covid
Addressing the risk of regional prices moving differently from national levels has become a bigger issue during Covid. I offer one way to address that risk using Pittsburgh as an example.

Recap of Activity in CME Case Shiller Home Price Index Contracts for Jan -note changes from Feb 2
I've posted a recap of activity in the CME Case Shiller home price index futures for January. The markets were quiet. A key theme reviewed is the importance of an outlook in the forward performance of any region vs a national index (or other indices).

Dec Recap published
I've posted a recap of activity in the CME Case Shiller home price index futures for December. Prices were mixed, bid/ask widened slightly, and curves flattened.

Vacation - Removing many quotes
I'm on vacation Dec 24-31. There may be many fewer quotes, but I am planning for a renewed effort in 2022.
Month-end Recap of activity in the CME Case Shiller futures contracts posted
I've posted a recap of activity in the CME Case Shiller home price index futures for November. In addition, I've framed a template for those looking to express a view on HPA (Home Price Appreciation) for 2022.

Case Shiller Futures React to Updated Indices
The Case Shiller index values released Tuesday morning were higher than "expectations" from the expiring Nov 2021 contract. In 7 of the 11 contracts, the index values fell outside the bid/ask quote from the day before. Longer-dated contract prices increased.

Expiring Nov '21 contract: 1) Challenges in Historical Time Series, and 2) Will Oct/Nov index values be flat in certain cities?
This quarterly recap of the expiring Case Shiller home price index contracts highlights two themes: one that users have to be careful in which data sources they use, and two that the Nov '21 contracts are priced as if nominal price MOM changes will be flat, in several regions.

Moving from California to Texas -Expressing and Measuring Views on Relative Home Price Changes
The blog both addresses the question of how much the migration from California to Texas might impact the relative performance of home prices between the two areas, and offers a platform for users to financially express such views.


An open letter to NAR conference attendees
NAR members enjoying their annual conference might allocate ten minutes to developing an appreciation of the concepts behind home price index hedging. It might help them, and their clients.

HPA Debate for 2022
Care to debate HPA for 2022. Consider using CME S&P Case Shiller home price index calendar spreads. The current market is consistent with ~2.5-4.0% HPA.

Recap of activity in CME S&P Case Shiller home price index futures for October
I've posted an update to activity in the CME S&P Case Shiller home price index contracts for October. This was the first month this year, that futures prices slipped.

CME S&P Case Shiller Home Price Index Futures -post Oct #'s
Prices on CME S&P Case Shiller home price futures slid after today's release of Case Shiller indices. YOY gains for 2021 (measuring the index released in Feb 2021 with the mid-market quote on the Feb '22 contract) remain strong.

One way to express a view in the debate over HPA (Home Price Appreciation) for 2022/ Updated w/ 10x10 quote in G22/G23
CME Calendar spread trades are one way that readers can express a view on either nationwide HPA for 2022, or on each of ten regions.

Recap for September: CME Case Shiller home price index futures
I've posted a recap to activity in the CME Case Shiller home price index futures for September.

FYI -Bids hit!
More trades took place in the CME Case Shiller home price index futures, and for the first time in recent memory bids were hit.
A new (school) year starts with 15 trades
The CME Case Shiller home price index futures seem to have awoken from their (one-sided) summer doldrums. There were 15 trades today across several regions. That resulted in tighter bid/ask spreads. I don't know whether this was someone's "New (school) Year's Resolution" or whether the debate on home price topping has been reached, but I'm open to facilitating any inquires.
August 2021 Contract Expiration - 2+ weeks away
As the August CME Case Shiller home price index futures approach expiration, there's been some trading and tighter markets. Here's an overdue update on what's going on.

CME market prices soar post June release of Case Shiller #'s
Quotes on CME Case Shiller home price index futures soared on Tuesday after the monthly release of updated indices.

Sufside - An anamoly or the canary in the coal mine?/ How to play MIA?
Are there any longer-term climate-related implications from the tragedy at Surfside, and if so, how might one express a view, without picking a top in prices?

Hedging Chicago (and other large cities)
I've expanded on an earlier blog about how to use HPHF Ratio Agreements using Chicago as a hedging example.

Updating Options
I've updated prices on puts on Case Shiller indices for Feb '22 and Feb '23 expirations.

Ratio Agreements - more cities
After illustrating how an HPHF Ratio Agreement might work for Atlanta, I've expanded the concept to show ratios for twenty cities.

Using HPHF Ratio Agreements to hedge other cities -Atlanta example
HPHF Ratio trades might be a useful tool to hedge home price index risk exposure, to those cities that are not referenced by CME Case Shiller futures contracts.

Recap of activity during May in CME Case Shiller Futures
I've posted a recap of the activity in the CME Case Shiller home price index futures for May 2021.

CME Case Shiller futures- post Tuesday Case Shiller #'s
The reaction of the CME Case Shiller home price index contracts to yesterday's updates of the CS indices poses some questions for where contract quotes are headed.

May 2021 Contracts Expire Today
The May 21 CME Case Shiller home price index futures stop trading today (at 3 PM Eastern) and settle on updated Case Shiller index numbers released tomorrow morning (Tuesday May 25th) at 9 AM.

S&P CME Case Shiller futures approach 15th anniversary
May22 will be the 15th anniversary of the first trade in the CME S&P Case Shiller futures. I've pulled together a high-level recap of some key themes, which will be followed by blogs going into much more detail on six key phases of trading in these contracts.

Belated April recap
I've posted a recap of activity in the CME Case Shiller home price index futures, for the month of April.

Market has repriced for further gains
The CME Case Shiller home price futures contracts have been repriced consistent with even larger gains for 2021.

A review: Adding/Reducing exposure to "other" cities
I've posted a review of one might use different forms of home price index derivatives in hedging strategies.

March Recap on CME Case Shiller futures
I've posted a recap on activity in the S&P CME Case Shiller home price index futures for March.

CME Futures post update to Case Shiller indices
Quotes on CME Case Shiller home price index futures are higher after this morning's release of index values through January.

Using Candle Bar Diagrams to illustrate clearing levels for home price index risk transfer
I'm dusted off an old tool -candle bar diagrams -to convert bids and offers on forward prices into percentage gains (or losses) to make comparisons across contracts with wildly different notional values, a bit easier.

Feb recap
I've posted a recap of activity in the CME Case Shiller home price index futures for February.

CME Case Shiller futures slightly higher post today's #'s
This morning's Case Shiller index updates were in line with quotes on the expiring (Feb '21) CME Case Shiller futures contract. Longer-dated market were up a small amount today in light trading.

.png)