There's a growing debate about where home prices are headed in the South. Some recent posts (e.g. Nick Gerli https://x.com/nickgerli1/status/1880274287015113110) have discussed that demographic flows to the South have slowed (but are still positive). Others have noted increased weather related losses(e.g. Asheville), and that insurance cost increases are likely to pick up (particularly in Florida). Further, building has been stronger in the South than in many other parts of the country.
On the other hand Zillow has recently raised it's forecasts for some Florida metros and, germane to this exercise, has Atlanta home prices outperforming the broader US market over the next year.
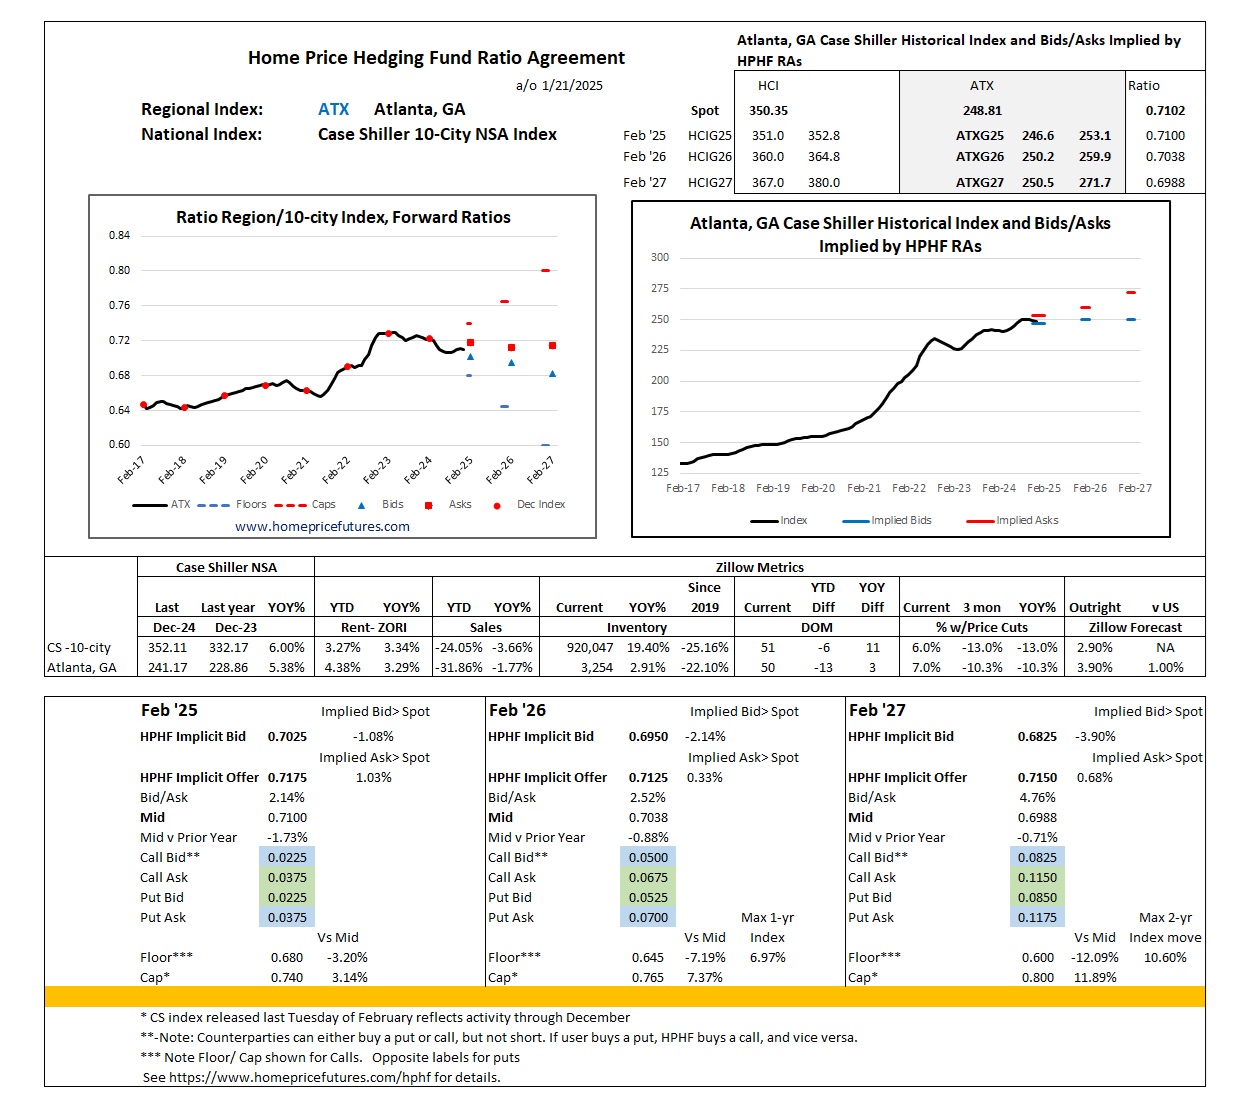
Historically, Atlanta has outperformed the 10-city index (see table) but was not quite as strong in 2023 (and YTD this year).
In addition, ATX (Atlanta symbol) year-on-year index changes have been highly correlated with those of the Case Shiller 10-city index (HCI or CUS). ^1

While some might decide that such highly correlated indices suggest that HCI contracts can be used as a hedge for ATX, there are no guarantees about future correlations.
Reader ask, how to express a view specific to ATX.
One approach to get long or short exposure to a benchmark city (that does not have a listed CME contract) is to combine CME Case Shiller 10-city home price index futures and HPHF Ratio Agreements ("RAs")^2 Simplistically, using Atlanta (ATX) as an example^3:

The two components are used as the CS 10-city index captured much of the Atlanta home price index movement over the last ten years. That is, the ATX index rose 87% between the Dec 2016 and Dec 2024 releases, while the the ATX/HCI ratio only moved 9.4% As such, moves in the HCI futures captured ~89% of the move in the ATX index.
The futures can protect users against the bigger price moves and as futures, eliminate counterparty risk to that price component. For example, the ATX index climbed over 21% in 2021. By contrast, the ATX/HCI Ratio Agreement has been much more stable with the biggest one-year move of 7% (and 2-year move of 10.6%).
While I've posted indicative levels that show the ATX/HCI ratio slipping into 2025/26 (i.e. ATX underperforming the 10-city index) the implied gains on the HCI Feb '26 and Feb '27 contracts still leads to higher outright prices for ATX for Feb '26 and Feb '27 index releases (ATXG26, ATXG27).
Net if you think Atlanta home prices will be lower at the end of 2025 or 2026, you can consider constructing a combination of CME futures and HPHF Ratio Agreements to "sell" Atlanta at above today's price levels.
I concede that there's a lot of information in the above illustration, and that executing such a strategy involves a few moving parts (including opening a futures account). Please feel free to fire away with any questions.
Also, since there are two components, there will be two bid/ask spreads to deal with. I'm happy to work at "inside levels" on the 10-city index futures to reduce the overall implied bid/ask on Atlanta combinations.
Note that this exercise can be applied to any city with a public Case Shiller index (e.g. Miami, Tampa, Charlotte, and Dallas)^4 Further one might consider HPHF RAs on any major city by referencing Freddie Mac indices.
^1 Although high correlations are sometimes the result of a small number of outlier moves (e.g. 2013, 2012)
^2 Another - where metro prices have been (and might be expected to be) highly correlated with the Case Shiller 10-city index, is just to hedge the metro with 10-city index futures. However, this illustation if for those looking to minimize the basis risk between the 10-city and metro indices.
^3 There are caps (and floors) on how far the ATX/10-city index ratio can move that limits the extent to which the formula is a 1:1 match of an outright view on Atlanta home prices.
^4 Note that there is a MIA (Miami) Case Shiller contract traded on the CME, but none for the other three cities mentioned.
#Atlantahomeprices #CaseShiller #hedginghomeprices #mortgages #HPHF #Atlantarealestate