As contributions for the quarterly Pulsenomics survey of home price forecasts (of the Fannie Mae home price index) are coming due, I thought that I'd revisit (and share) my approach on how I project forward Fannie Mae index values. While this does result in my contributions to the survey, my primary goal is for users to realize that a key tool for any home price forecast already exists -the Case Shiller 10-city home price index futures that are traded on the CME. (Note, that while I've long argued that CME contracts represent the level where (a very small number of) users are willing to transfer risk, and not necessarily the expectations of a broader audience, users posting quotes on the CME must take into account expectations, as otherwise market participants will jump on any outlier views.)
(Note that my theories were first outlined in a blog in May - bit.ly/FNCS0525 - and I'd encourage readers to review that for more details.)
A secondary goal would be to preemptively challenge Pulsenomics contributors from posting extreme outlier goals (and thus reduce the standard deviation of results). While such outlier views might gain the contributors some notoriety, I don't think that they help those looking to add/reduce home price exposure (to include first-time buyers). Any such participants with large outlier views are invited to share their forecasting process here (vs mine) and to take the appropriate side of either a CME contract, or an OTC Fannie Mae index agreement.
My thesis for forecasting Fannie Mae index values is that that index moves "generally" in line with the Case Shiller 10-city index, and that the CME futures that reference the Case Shiller 10-city index convey some information on market expectations of future home prices (with the above qualifier).
From a high level it appears that the Fannie Mae index and the CS 10-city index track each other over long periods of time.

However the indices have different approaches (e.g. Fannie Mae adds appraisals while CS relies on repeat sales) the Fannie Mae index is more national, and the homeowners backing the Fannie Mae data tend to be higher quality. Might those not all move in sync.
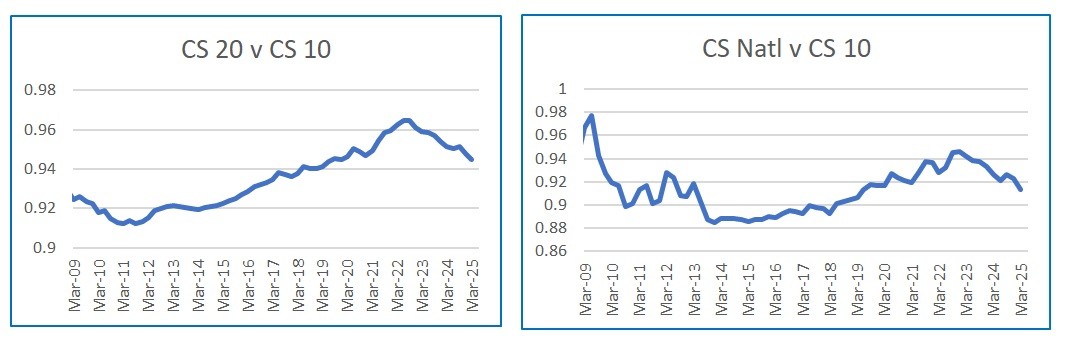
To account for the more national database for Fannie Mae, I first mapped the ratios of the CS20 and CS National indices vs the CS 10 Index. As shown below, while both the CS 20 and CS National outperformed the CS from 2013-2022 (note that a rising ratio means that the numerator has done relatively better than the denominator), that there's been a reversal over the last few years. That gibes with market commentary that that some parts of the country that are underrepresented in the CS 10 index (e.g. the Southeast, the Pacific Northwest, Texas and the Mountain States) have been experiencing home price weakness.
Net, the Case Shiller 10-city index has outperformed the more national CS indices, and seems likely (IMHO) to continue to do so.
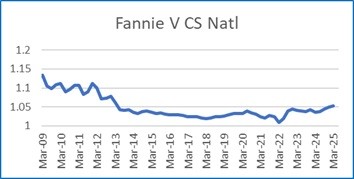
Next, I want to compare the Case Shiller National Index with the Fannie Mae index. Since both are measures of national home prices, I would suggest that any differences might be a result of the performance of home prices with loans given to higher quality borrowers.
As shown below, the Fannie Mae index tended to (very slightly) underperform the Case Shiller National index from 2009-2022, possibly as lower FICO score borrowers bought homes in new areas that saw (slightly relatively) better home price appreciation. However, since 2022, the Fannie Mae index has begun to outperform the Case Shiller National Index.
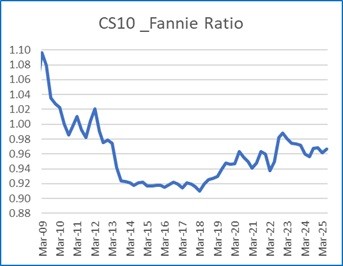
So, the more National exposure would seem to have hurt the Fannie Mae index (relative to CS 10) but the higher credit quality might tip the balance to Fannie Mae.
in fact, the ratio of the CS 10/ Fannie Mae indices shows that the CS 10 index has outperformed since, but relative gains have been (and may be?) small going forward.
Given that, here's my Fannie Mae forecasts for the next five years. (Recall that the Feb expirations reference the year-end values of the Case Shiller indices, so HCIG26 -which is the Feb 2026 contract on the 10-city index - will settle on the CS-10-city value for year-end 2025. Note that I've not been posting quotes for beyond HCIG28 (when I turn 75!) and am looking for someone to take that role.
Note that I've given no credit for Fannie quality outperformance for 2025-26, but then add a small amount per year.
Further, I add a small bump to Fannie Mae forecasts (at least relative to CS10) to compensate for my views that futures have tended to clear at a discount to expectations -with a bigger discount, the longer the timeframe.
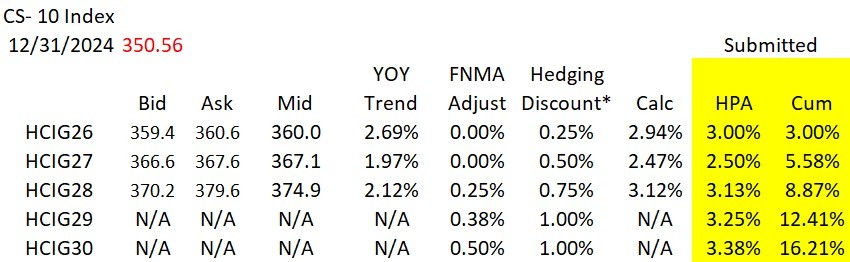
So...lots of moving parts but my primary thesis remains - that the CME Case Shiller 10-city index futures can be used as a tool to project Fannie Mae index values into the future. While I would agree that there's a number of moving parts, I would challenge those who contribute cumulative HPA out to year-end 2027 (so the HCIG28 contract) of <2% or >16% forecasts to engage in a CME futures trade.
Please feel free to DM me here if you'd like to debate this analysis or if you have alternative ways to forecast index values that you'd like an audience to see. (Note I welcome any contributions on either home price forecasts or the mechanics of hedging home prices.)
Thanks, John